위키피디아에 있는 쿨백-라이블러 발산(Kullback–Leibler divergence, 이하 KLD)의 정의에 대해 잠깐 정리하자면, 다음과 같다.
KLD는 두 확률분포의 차이를 계산하는 데에 사용하는 함수로, 어떤 이상적인 분포에 대해, 그 분포를 근사하는 다른 분포를 사용해 샘플링을 한다면 발생할 수 있는 정보 엔트로피 차이를 계산한다. 상대 엔트로피(relative entropy), 정보 획득량(information gain), 인포메이션 다이버전스(information divergence)라고도 한다. 정보이론에서는 상대 엔트로피, 기계학습의 결정 트리에서는 정보 획득량을 주로 사용한다.
쿨백-라이블러 발산은 비대칭으로, 두 값의 위치를 바꾸면 함수값도 달라진다. 따라서 이 함수는 거리 함수는 아니다.
두 확률분포의 차이를 계산한다고 나와있는데, 여기서 계산하는 차이는 "엔트로피"이다. 두 분포가 관여하는 개념이었던 cross entropy가 떠오를텐데 cross entropy로 부터 KLD가 무엇인지 수식으로 유도가능하다. 이와 관련해서 정말 친절히 설명해 주신 블로그가 있기에 자세한 내용은 아래의 블로그를 참고하길 바란다.
초보를 위한 정보이론 안내서 - KL divergence 쉽게 보기
사실 KL divergence는 전혀 낯선 개념이 아니라 우리가 알고 있는 내용에 이미 들어있는 개념입니다. 두 확률분포 간의 차이를 나타내는 개념인 KL divergence가 어디서 나온 것인지 먼저 파악하고, 이��
hyunw.kim
이 포스팅에서는 KLD의 간단한 설명부터 정규분포간의 KLD를 구해서 이미지의 단서(특징)를 포착하는 것에 대해 다루고자 합니다.
1. KLD의 정의와 특징
KLD는 2개의 확률분포가 어느 정도 닮았는지를 나타내는 척도이다. 정의는 아래와 같다.

KLD의 중요한 특징은 2가지 있다.
첫 번째는, 같은 확률분포에서는 0이 되는 것이다.

두 번째는 항상 0을 포함한 정의 값이 되고, 확률 분포가 닮지 않을수록 큰 값이 된다는 것이다.
즉 , KL(p|q)≥0라고 할 수 있겠다.
2. 정규분포
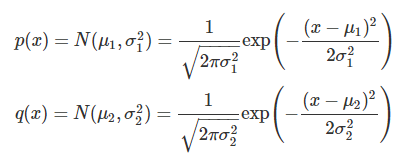
정규분포의 확률 밀도 함수 p(x)와 q(x)는 아래와 같은 식으로 정의되어 있다.

3. 정규분포간의 KLD
위 2 개의 정규분포간의 KLD를 구해보자. 계산은 생략한다.

변수가 4개라서 알기 쉽지 않기 때문에, p(x)를 평균0, 분산1의 표준정규분포 N(0,1)로 한다.

4. 평균이 변수의 경우
먼저 q(x)의 표준편차 σ2를 1로써, 평균 μ2만을 변수라고 가정한다.

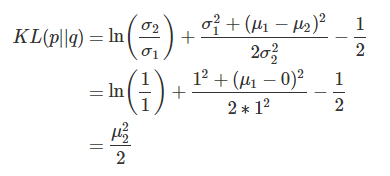
이 때의 KLD는 아래의 식과 같다.

μ2의 값을 -4로부터 4까지 1씩 증가시켰을 때의 확률분포 q(x)과 KLD KL(p||q)의 값은 아래와 같이 된다.

좌측의 오렌지 색의 선이 평균 μ2을 변화시켰을 때의 q(x)이다. 우측의 그림은 평균 μ2을 x축으로 정렬했을 때의 그림이된다. 그림에서 파란색의 선은 해석해고, 오랜지색의 점은 현재의 KLD의 값이 된다. KLD는 p(x)와 q(x)가 완전히 일치할 때 0이 되고 떨어질 수록 값이 커지는 것을 확인할 수 있었다.
위 식을 나타낼 때 사용한 python 코드는 아래와 같다.
import numpy as np
import matplotlib.pyplot as plt
import matplotlib.animation as animation

# 正規分布
def gaussian1d(x,μ,σ):
    y = 1 / ( np.sqrt(2*np.pi* σ**2 ) )  * np.exp( - ( x - μ )**2  / ( 2 * σ ** 2 ) )
    return y

# 正規分布のKL divergence
def gaussian1d_KLdivergence(μ1,σ1,μ2,σ2):
    A = np.log(σ2/σ1)
    B = ( σ1**2 + (μ1 - μ2)**2 ) / (2*σ2**2)
    C = -1/2
    y = A + B + C
    return y

# KL divergence
def KLdivergence(p,q,dx):
    KL=np.sum(p * np.log(p/q)) * dx
    return KL

# xの刻み
dx  = 0.01

# xの範囲
xlm = [-6,6]

# x座標
x   = np.arange(xlm[0],xlm[1]+dx,dx)

# xの数
x_n   = len(x)

# Case 1
# p(x) = N(0,1)
# q(x) = N(μ,1)

# p(x)の平均μ1
μ1   = 0
# p(x)の標準偏差σ1
σ1   = 1

# p(x)
px   = gaussian1d(x,μ1,σ1)

# q(x)の標準偏差σ2
σ2   = 1

# q(x)の平均μ2
U2   = np.arange(-4,5,1)

U2_n = len(U2)

# q(x)
Qx   = np.zeros([x_n,U2_n])

# KLダイバージェンス
KL_U2  = np.zeros(U2_n)

for i,μ2 in enumerate(U2):
    qx        = gaussian1d(x,μ2,σ2)
    Qx[:,i]   = qx
    KL_U2[i]  = KLdivergence(px,qx,dx)


# 解析解の範囲
U2_exc    = np.arange(-4,4.1,0.1)

# 解析解
KL_U2_exc = gaussian1d_KLdivergence(μ1,σ1,U2_exc,σ2)

# 解析解2
KL_U2_exc2 = U2_exc**2 / 2

#
# plot
#

# figure
fig = plt.figure(figsize=(8,4))
# デフォルトの色
clr=plt.rcParams['axes.prop_cycle'].by_key()['color']

# axis 1
#-----------------------
# 正規分布のプロット
ax = plt.subplot(1,2,1)
# p(x)
plt.plot(x,px,label='$p(x)$')
# q(x)
line,=plt.plot(x,Qx[:,i],color=clr[1],label='$q(x)$')
# 凡例
plt.legend(loc=1,prop={'size': 13})

plt.xticks(np.arange(xlm[0],xlm[1]+1,2))
plt.xlabel('$x$')

# axis 2
#-----------------------
# KLダイバージェンス
ax2 = plt.subplot(1,2,2)
# 解析解
plt.plot(U2_exc,KL_U2_exc,label='Analytical')
# 計算
point, = ax2.plot([],'o',label='Numerical')

# 凡例
# plt.legend(loc=1,prop={'size': 15})

plt.xlim([U2[0],U2[-1]])
plt.xlabel('$\mu$')
plt.ylabel('$KL(p||q)$')

plt.tight_layout()

# 軸に共通の設定
for a in [ax,ax2]:
    plt.axes(a)
    plt.grid()
    # 正方形に
    plt.gca().set_aspect(1/plt.gca().get_data_ratio())

# 更新
def update(i):
    # 線
    line.set_data(x,Qx[:,i])
    # 点
    point.set_data(U2[i],KL_U2[i])

    # タイトル
    ax.set_title("$\mu_2=%.1f$" % U2[i],fontsize=15)
    ax2.set_title('$KL(p||q)=%.1f$' % KL_U2[i],fontsize=15)

# アニメーション
ani = animation.FuncAnimation(fig, update, interval=1000,frames=U2_n)
# plt.show()
# ani.save("KL_μ.gif", writer="imagemagick")
5. 표준편차가 변수일 때
계속해서 q(x)의 평균 μ2를 0으로, 표준편차 σ2만을 변수로 한다.

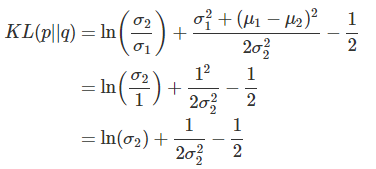
이 때의 KLD는 아래의 식과 같다.

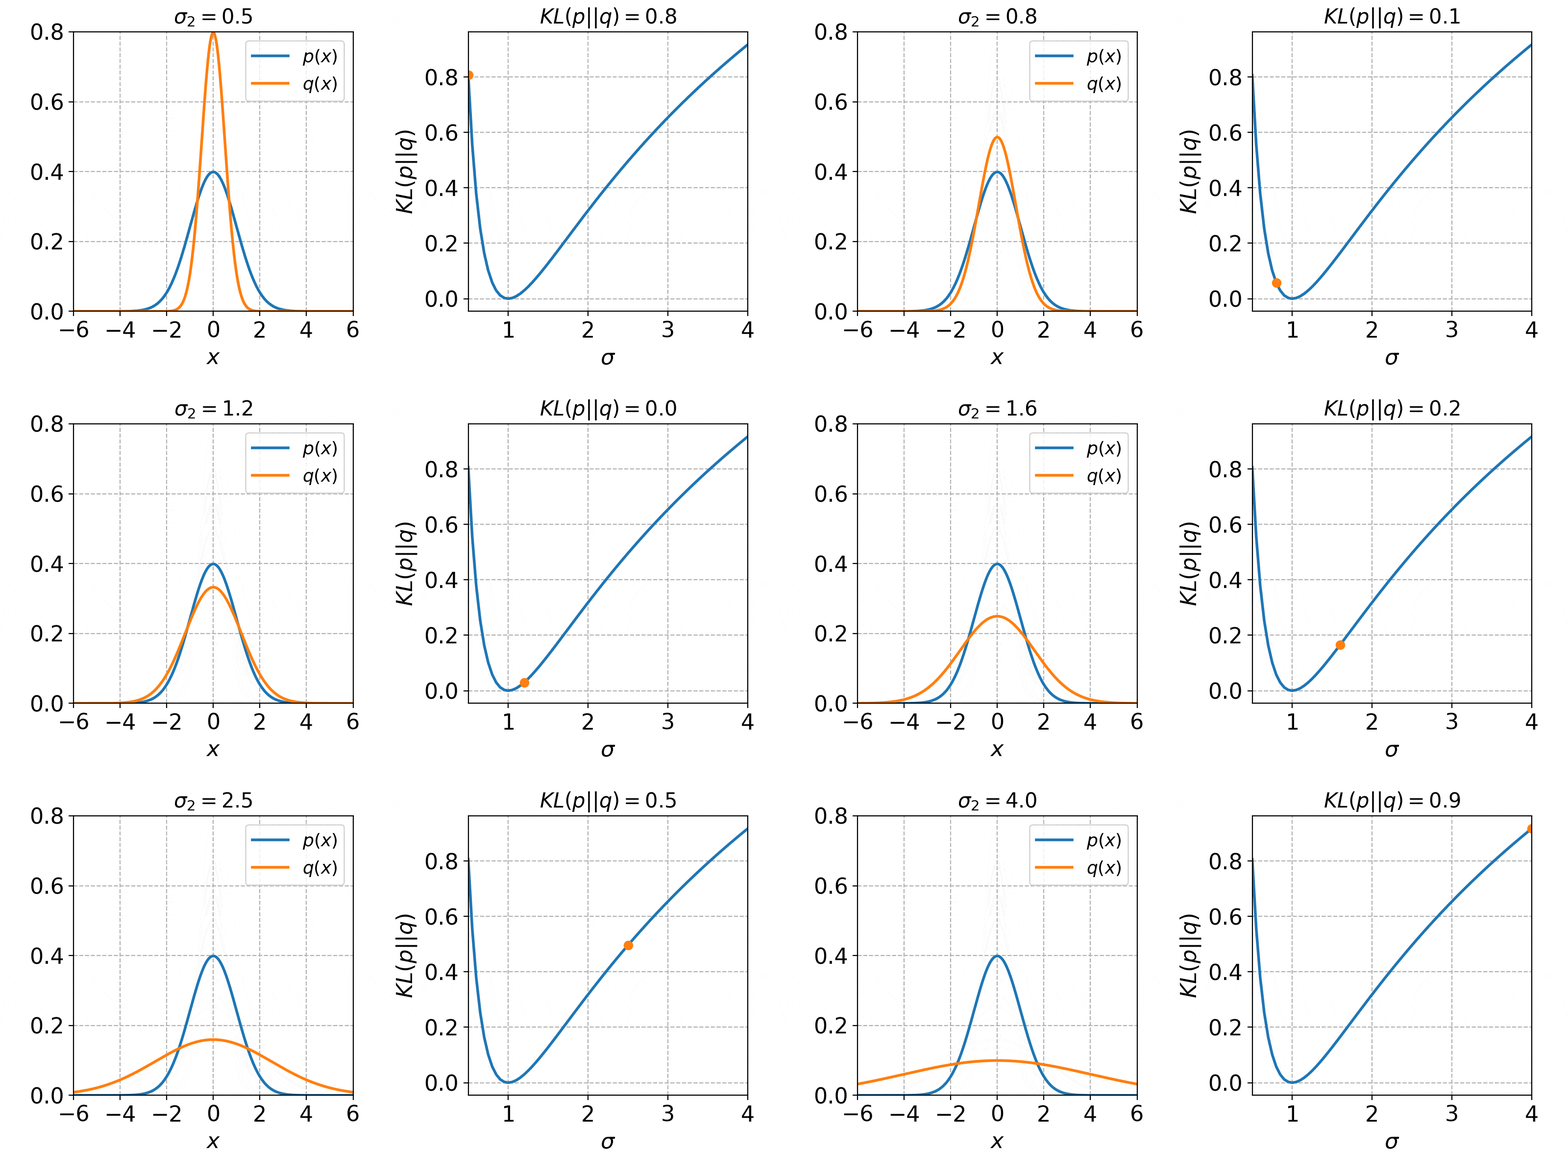
σ2의 값을 0.5부터 4까지의 수로 변화를 줬을 때의 확률분포 q(x)와 KLD KL(p||q)의 값은 아래와 같이 된다.

KLD의 변화를 살펴보면, 아까의 그림과 같이 확률분포가 일치했을 때 0이 되고, 분포의 형태나 다른 정도에 따라 값이 증가하고 있다는 특징을 볼 수 있다.
위 그림을 나타낼 때 사용한 python 코드는 다음과 같다.
import numpy as np
import matplotlib.pyplot as plt
import matplotlib.animation as animation

# 正規分布
def gaussian1d(x,μ,σ):
    y = 1 / ( np.sqrt(2*np.pi* σ**2 ) )  * np.exp( - ( x - μ )**2  / ( 2 * σ ** 2 ) )
    return y

# 正規分布のKL divergence
def gaussian1d_KLdivergence(μ1,σ1,μ2,σ2):
    A = np.log(σ2/σ1)
    B = ( σ1**2 + (μ1 - μ2)**2 ) / (2*σ2**2)
    C = -1/2
    y = A + B + C
    return y

# KL divergence
def KLdivergence(p,q,dx):
    KL=np.sum(p * np.log(p/q)) * dx
    return KL

# xの刻み
dx  = 0.01

# xの範囲
xlm = [-6,6]

# x座標
x   = np.arange(xlm[0],xlm[1]+dx,dx)

# xの数
x_n   = len(x)

# Case 2
# p(x) = N(0,1)
# q(x) = N(0,σ**2)

# p(x)の平均μ1
μ1   = 0
# p(x)の標準偏差σ1
σ1   = 1

# p(x)
px   = gaussian1d(x,μ1,σ1)

# q(x)の平均μ2
μ2   = 0

# q(x)の標準偏差σ2
S2   = np.hstack([ np.arange(0.5,1,0.1),np.arange(1,2,0.2),np.arange(2,4.5,0.5) ])

S2_n = len(S2)

# q(x)
Qx   = np.zeros([x_n,S2_n])

# KLダイバージェンス
KL_S2  = np.zeros(S2_n)

for i,σ2 in enumerate(S2):
    qx        = gaussian1d(x,μ2,σ2)
    Qx[:,i]   = qx
    KL_S2[i]  = KLdivergence(px,qx,dx)


# 解析解の範囲
S2_exc    = np.arange(0.5,4+0.05,0.05)

# 解析解
KL_S2_exc = gaussian1d_KLdivergence(μ1,σ1,μ2,S2_exc)

# 解析解2
KL_S2_exc2 = np.log(S2_exc) + 1/(2*S2_exc**2) - 1 / 2

#
# plot
#

# figure
fig = plt.figure(figsize=(8,4))
# デフォルトの色
clr=plt.rcParams['axes.prop_cycle'].by_key()['color']

# axis 1
#-----------------------
# 正規分布のプロット
ax = plt.subplot(1,2,1)
# p(x)
plt.plot(x,px,label='$p(x)$')
# q(x)
line,=plt.plot(x,Qx[:,i],color=clr[1],label='$q(x)$')
# 凡例
plt.legend(loc=1,prop={'size': 13})

plt.ylim([0,0.8])
plt.xticks(np.arange(xlm[0],xlm[1]+1,2))
plt.xlabel('$x$')

# axis 2
#-----------------------
# KLダイバージェンス
ax2 = plt.subplot(1,2,2)
# 解析解
plt.plot(S2_exc,KL_S2_exc,label='Analytical')
# 計算
point, = ax2.plot([],'o',label='Numerical')

# 凡例
# plt.legend(loc=1,prop={'size': 15})

plt.xlim([S2[0],S2[-1]])
plt.xlabel('$\sigma$')
plt.ylabel('$KL(p||q)$')

plt.tight_layout()

# 軸に共通の設定
for a in [ax,ax2]:
    plt.axes(a)
    plt.grid()
    # 正方形に
    plt.gca().set_aspect(1/plt.gca().get_data_ratio())

# 更新
def update(i):
    # 線
    line.set_data(x,Qx[:,i])
    # 点
    point.set_data(S2[i],KL_S2[i])

    # タイトル
    ax.set_title("$\sigma_2=%.1f$" % S2[i],fontsize=15)
    ax2.set_title('$KL(p||q)=%.1f$' % KL_S2[i],fontsize=15)

# アニメーション
ani = animation.FuncAnimation(fig, update, interval=1000,frames=S2_n)
plt.show()
# ani.save("KL_σ.gif", writer="imagemagick")
6. 평균, 표준편차가 변수인 경우
평균 μ2와 표준편차 σ2 모두 변수일 때의 KLD의 값을 나타내면 아래와 같다.

+) 추가자료

사용한 python 코드는 아래와 같다.
import numpy as np
import matplotlib.pyplot as plt

# 正規分布
def gaussian1d(x,μ,σ):
    y = 1 / ( np.sqrt(2*np.pi* σ**2 ) )  * np.exp( - ( x - μ )**2  / ( 2 * σ ** 2 ) )
    return y

# 正規分布のKL divergence
def gaussian1d_KLdivergence(μ1,σ1,μ2,σ2):
    A = np.log(σ2/σ1)
    B = ( σ1**2 + (μ1 - μ2)**2 ) / (2*σ2**2)
    C = -1/2
    y = A + B + C
    return y

# KL divergence
def KLdivergence(p,q,dx):
    KL=np.sum(p * np.log(p/q)) * dx
    return KL

def Motion(event):
    global cx,cy,cxid,cyid

    xp = event.xdata
    yp = event.ydata

    if (xp is not None) and (yp is not None):
        gca = event.inaxes

        if gca is axs[0]:
            cxid,cx = find_nearest(x,xp)
            cyid,cy = find_nearest(y,yp)

            lns[0].set_data(G_x,Qx[:,cxid,cyid])
            lns[1].set_data(x,Z[:,cyid])
            lns[2].set_data(y,Z[cxid,:])


            lnhs[0].set_ydata([cy,cy])
            lnvs[0].set_xdata([cx,cx])

            lnvs[1].set_xdata([cx,cx])
            lnvs[2].set_xdata([cy,cy])


        if gca is axs[2]:
            cxid,cx = find_nearest(x,xp)

            lns[0].set_data(G_x,Qx[:,cxid,cyid])
            lns[2].set_data(y,Z[cxid,:])
            lnvs[0].set_xdata([cx,cx])
            lnvs[1].set_xdata([cx,cx])

        if gca is axs[3]:
            cyid,cy = find_nearest(y,xp)

            lns[0].set_data(G_x,Qx[:,cxid,cyid])
            lns[1].set_data(x,Z[:,cyid])
            lnhs[0].set_ydata([cy,cy])
            lnvs[2].set_xdata([cy,cy])

    axs[1].set_title("$\mu_2=%5.2f, \sigma_2=$%5.2f" % (cx,cy),fontsize=15)
    axs[0].set_title('$KL(p||q)=$%.3f' % Z[cxid,cyid],fontsize=15)

    plt.draw()

def find_nearest(array, values):
    id = np.abs(array-values).argmin()
    return id,array[id]

# xの刻み
G_dx  = 0.01
# xの範囲
G_xlm = [-4,4]
# x座標
G_x   = np.arange(G_xlm[0],G_xlm[1]+G_dx,G_dx)
# xの数
G_n   = len(G_x)

# p(x)の平均μ1
μ1   = 0
# p(x)の標準偏差σ1
σ1   = 1
# p(x)
px   = gaussian1d(G_x,μ1,σ1)

# q(x)の平均μ2
μ_lim = [-2,2]
μ_dx  = 0.1
μ_x   = np.arange(μ_lim[0],μ_lim[1]+μ_dx,μ_dx)
μ_n   = len(μ_x)

# q(x)の標準偏差σ2
σ_lim = [0.5,4]
σ_dx  = 0.05
σ_x   = np.arange(σ_lim[0],σ_lim[1]+σ_dx,σ_dx)
σ_n   = len(σ_x)

# KLダイバージェンス
KL   = np.zeros([μ_n,σ_n])
# q(x)
Qx   = np.zeros([G_n,μ_n,σ_n])

for i,μ2 in enumerate(μ_x):
    for j,σ2 in enumerate(σ_x):
        KL[i,j]   = gaussian1d_KLdivergence(μ1,σ1,μ2,σ2)
        Qx[:,i,j] = gaussian1d(G_x,μ2,σ2)

x   = μ_x
y   = σ_x

X,Y = np.meshgrid(x,y)
Z   = KL

cxid  = 0
cyid  = 0

cx    = x[cxid]
cy    = y[cyid]

xlm   = [ x[0], x[-1] ]
ylm   = [ y[0], y[-1] ]

axs   = []
ims   = []
lns   = []
lnvs  = []
lnhs  = []

# figure
#----------------
plt.close('all')
plt.figure(figsize=(8,8))
# デフォルトの色
clr=plt.rcParams['axes.prop_cycle'].by_key()['color']

# フォントサイズ
plt.rcParams["font.size"] = 16
# 線幅
plt.rcParams['lines.linewidth'] = 2
# gridのlinestyleを点線に
plt.rcParams["grid.linestyle"] = '--'

# plot時の範囲のマージンをなくす
plt.rcParams['axes.xmargin'] = 0.

# ax1
#----------------
ax = plt.subplot(2,2,1)

Interval = np.arange(0,8,0.1)
plt.plot(μ1,σ1,'rx',label='$(μ_1,σ_1)=(0,1)$')
im = plt.contourf(X,Y,Z.T,Interval,cmap='hot')
lnv= plt.axvline(x=cx,color='w',linestyle='--',linewidth=1)
lnh= plt.axhline(y=cy,color='w',linestyle='--',linewidth=1)

ax.set_title('$KL(p||q)=$%.3f' % Z[cxid,cyid],fontsize=15)
plt.xlabel('μ')
plt.ylabel('σ')

axs.append(ax)
lnhs.append(lnh)
lnvs.append(lnv)
ims.append(im)

# ax2
#----------------
ax = plt.subplot(2,2,2)
plt.plot(G_x,px,label='$p(x)$')
ln, = plt.plot(G_x,Qx[:,cxid,cyid],color=clr[1],label='$q(x)$')
plt.legend(prop={'size': 10})
ax.set_title("$\mu_2=%5.2f, \sigma_2=$%5.2f" % (cx,cy),fontsize=15)

axs.append(ax)
lns.append(ln)
plt.grid()

# ax3
#----------------
ax = plt.subplot(2,2,3)
ln,=plt.plot(x,Z[:,cyid])
lnv= plt.axvline(x=cx,color='k',linestyle='--',linewidth=1)

plt.ylim([0,np.max(Z)])
plt.grid()
plt.xlabel('μ')
plt.ylabel('KL(p||q)')

lnvs.append(lnv)
axs.append(ax)
lns.append(ln)

# ax4
#----------------
ax = plt.subplot(2,2,4)
ln,=plt.plot(y,Z[cxid,:])

lnv= plt.axvline(x=cy,color='k',linestyle='--',linewidth=1)

plt.ylim([0,np.max(Z)])
plt.xlim([ylm[0],ylm[1]])
plt.grid()

plt.xlabel('σ')
plt.ylabel('KL(p||q)')

lnvs.append(lnv)
axs.append(ax)
lns.append(ln)

plt.tight_layout()

for ax in axs:
    plt.axes(ax)
    ax.set_aspect(1/ax.get_data_ratio())

plt.connect('motion_notify_event', Motion)

plt.show()
참고자료
'IT > AI\ML' 카테고리의 다른 글
| ipywidgets 사용법 (1) (0) | 2021.04.06 |
|---|---|
| [논문] 최근 AI의 이미지 인식에서 화제인 "Vision Transformer"에 대한 해설 (0) | 2020.10.16 |
| [수학/분포] 확률변수 Jensen 부등식의 직감적 이해 (0) | 2020.08.06 |
| GAN ; PG-GAN(Progressive Growing of GANs) (0) | 2020.07.06 |
| 머신러닝 분류 모델의 성능평가 (0) | 2020.05.27 |