1) Pandas
(1) Pandas란
구조화된 데이터의 처리를 지원하는 Python라이브러리 = Python계의 엑셀
(2) Pandas의 특징
- 구조화된 데이터의 처리를 지원하는 Python 라이브러리
- 고성능 Array계산 라이브러리인 Numpy와 통합하여, 강력한 "스프레드시트"처리 기능을 제공
- 인덱싱, 연산용 함수, 전처리 함수 등을 제공함
(3) 데이터 로딩
import pandas as pd # 라이브러리 호출
data_url = "http://~"
df_data = pd.read_csv(data_url, sep="\s+", header = None) # csv타입 데이터 로드, separate는 빈 공간으로 지정하고, Column은 없음
df_data.head() #처음 다섯줄 출력
2) Series
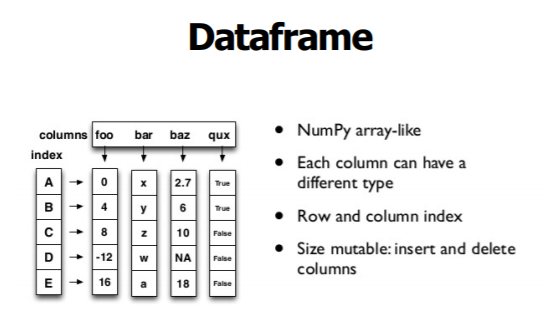
(1) Pandas의 구성

(2) 일반적인 pandas의 활용
앞에서 본 코드의 이 두 줄이 기존 데이터를 불러와서 DataFrame을 생성하는 부분이다.
data_url = "http://~"
df_data = pd.read_csv(data_url, sep="\s+", header = None) # csv타입 데이터 로드, separate는 빈 공간으로 지정하고, Column은 없음
(3) Series
- Column Vector을 표현하는 object
- numpy.ndarry의 서브클래스
- 어떤 data type도 사용가능
- 인덱스 라벨의 정렬은 정의할 필요가 없음
- Duplicates 가능
Series(data = None, index = None, dtype = None, name = None, copy = False, fastpath = False)from pandas import Series, DataFrame
import pandas as pd
list_data = [1,2,3,4,5]
example_obj = Series(data=list_data)
print(example_obj)
>>
0 1
2 3
3 4
4 5
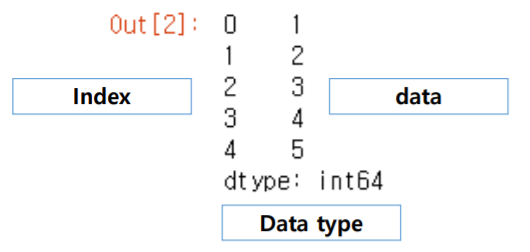
dtype: int64출련된 결과는 아래와 같은 의미를 지닌다.

아래와 같이 index 옵션으로 index 이름을 지정하는 것도 가능하다.
from pandas import Series, DataFrame
import pandas as pd

list_data = [1,2,3,4,5]
list_name = ["a", "b", "c", "d", "e"]
example_obj = Series(data=list_data, index=list_name)
print(example_obj)

>>
a    1
b    2
c    3
d    4
e    5
dtype: int64
또한 dtype옵션으로 data type을 설정할 수 있으며, name옵션으로 Seriese 이름을 설정할 수 있다.
from pandas import Series, DataFrame
import pandas as pd
import numpy as np

dict_data = {"a":1, "b":2, "c":3, "d":4, "e":5}
example_obj = Series(dict_data, dtype=np.float32, name="example_data")
print(example_obj)

>>
a    1.0
b    2.0
c    3.0
d    4.0
e    5.0
Name: example_data, dtype: float32

print(example_obj["a"]) #data index에 접근하기
>> 1.0

example_obj["a"] = 3.2 #data index에 값 할당하기
print(example_obj)
>>
a    3.2
b    2.0
c    3.0
d    4.0
e    5.0
Name: example_data, dtype: float32

print(example_obj.values) # 값 리스트만
>> [3.2 2.  3.  4.  5. ]

print(example_obj.index) # Index 리스트만
>> Index(['a', 'b', 'c', 'd', 'e'], dtype='object')

# Data에 대한 정보를 저장
example_obj.name = "number"
example_obj.index.name = "alphabet"
print(example_obj)
>> alphabet
a    3.2
b    2.0
c    3.0
d    4.0
e    5.0
Name: number, dtype: float32
from pandas import Series, DataFrame
import pandas as pd
import numpy as np
dict_data_1 = {"a":1, "b":2, "c":3, "d":4, "e":5}
indexes = ["a", "b", "c", "d", "e", "f", "g", "h"]
series_obj_1 = Series(dict_data_1, index=indexes) # index 값을 기준으로 series 생성
print(series_obj_1)
>>
a 1.0
b 2.0
c 3.0
d 4.0
e 5.0
f NaN
g NaN
h NaN
dtype: float643) Dataframe Overview
(1) Dataframe
- Series를 모아서 만든 Data Table = 기본 2차원
DataFrame(data=None, index=None, columns=None, dtype=None, copy=False )
from pandas import Series, DataFrame
import pandas as pd
import numpy as np

# column_name : data
raw_data = {'first_name': ['Jason', 'Molly', 'Tina', 'Jake', 'Amy'],
        'last_name': ['Miller', 'Jacobson', 'Ali', 'Milner', 'Cooze'],
        'age': [42, 52, 36, 24, 73],
        'city': ['San Francisco', 'Baltimore', 'Miami', 'Douglas', 'Boston']}
df = pd.DataFrame(raw_data, columns = ['first_name', 'last_name', 'age', 'city'])
print(df)
>>
  first_name last_name  age           city
0      Jason    Miller   42  San Francisco
1      Molly  Jacobson   52      Baltimore
2       Tina       Ali   36          Miami
3       Jake    Milner   24        Douglas
4        Amy     Cooze   73         Boston


# (1) column 선택
result1 = DataFrame(raw_data, columns = ["age", "city"])
print(result1)
>>
   age           city
0   42  San Francisco
1   52      Baltimore
2   36          Miami
3   24        Douglas
4   73         Boston


# (2) 새로운 column 추가
result2 = DataFrame(raw_data,
          columns = ["first_name","last_name","age", "city", "debt"]
         )
print(result2)
>>
  first_name last_name  age           city debt
0      Jason    Miller   42  San Francisco  NaN
1      Molly  Jacobson   52      Baltimore  NaN
2       Tina       Ali   36          Miami  NaN
3       Jake    Milner   24        Douglas  NaN
4        Amy     Cooze   73         Boston  NaN


# (3) column 선택 - series 추출
df = DataFrame(raw_data, columns = ["first_name","last_name","age", "city", "debt"])
print(df.first_name)
>>
0    Jason
1    Molly
2     Tina
3     Jake
4      Amy


# (4) column 선택 - series 추출
df["first_name"]
>>
0    Jason
1    Molly
2     Tina
3     Jake
4      Amy
Name: first_name, dtype: object


# (5) loc = index location ; 인덱스의 이름을 이용하여 값에 접근 (해당row의 값을 가져옴)
print(df.loc[1])
>>
first_name        Molly
last_name      Jacobson
age                  52
city          Baltimore
debt                NaN
Name: 1, dtype: object


# (6) ilock = index position ; 인덱스의 위치를 이용하여 값에 접근 (해당 column의 값을 가져옴)
print(df["age"].iloc[1:])
>>
1    52
2    36
3    24
4    73
Name: age, dtype: int64


# (7) 다른 property로 부터 새로운 fature를 만들어 줄 때 주로 사용한다.
df.debt = df.age > 40


# (8) transpose
df.T


# (9) 값 출력
df.values


# (10) csv 변환
df.to_csv()


# (11) Column 삭제
del df["debt"]
# loc은 index 이름, iloc은 index number
s = pd.Series(np.nan, index=[49,48,47,46,45, 1, 2, 3, 4, 5])
print(s)
>>
49   NaN
48   NaN
47   NaN
46   NaN
45   NaN
1    NaN
2    NaN
3    NaN
4    NaN
5    NaN
dtype: float64


s.iloc[:3]
>>
49   NaN
48   NaN
47   NaN
dtype: float64
from pandas import Series, DataFrame
import pandas as pd
import numpy as np

# Nested dict에서는 'Column값':{idex:값} 형태
pop = {'Nevada': {2001: 2.4, 2002: 2.9},
 'Ohio': {2000: 1.5, 2001: 1.7, 2002: 3.6}}

DataFrame(pop)

>>
       Nevada  Ohio
2001     2.4   1.7
2002     2.9   3.6
2000     NaN   1.5
4) Selection & Drop
(1) Selection with column names
# 한 개의 column 선택시
df["account"].head(3)


# 1개 이상의 column 선택
df [["account", "street, "state"]].head(3)
(2) Selection with index number
# column 이름 없이 사용하는 index number는 row 기준 표시
df[:3]

# column 이름과 함께 row index 사용시, 해당 column만
df["account"][:3]
(3) Series selection
account_series = df["account"]
account_serise[:3]

# 1개 이상의 index
account_series[[0, 1, 2]]

# Boolean index
account_series[account_series < 250000]
(4) Index 변경
df.index = df["account"]
del df["account"]
df.head()
(5) Basic, loc, iloc selection
# Column과 index number
df[["name", "street"]][:2]

# Column number와 index number
df.iloc[:2,:2]

# Column과 index name
df.loc[[211829, 320563],["name","street"]]
(6) index 재절성
df.index = list(range(0,15))
(7) Data drop
# Index number로 drop
df.drop(1)

# 한 개 이상의 Index number로 drop
df.drop([0, 1, 2, 3])

# axis 지정으로 축 기준으로 drop > column 중에서 "city"
df.drop("city", axis=1)
5) Dataframe Operations
(1) Series operation
s1 = Series(range(1,6), index = list("abced"))
print(s1)
>>
a    1
b    2
c    3
e    4
d    5
dtype: int64

s2 = Series(range(5,11), index=list("bcedef"))
print(s2)
>>
b     5
c     6
e     7
d     8
e     9
f    10
dtype: int64

# index으로 기준으로 연산수행하며, 겹쳐지는 index가 없을 경우 NaN값으로 반환
s1.add(s2)
>>
a     NaN
b     7.0
c     9.0
d    13.0
e    11.0
e    13.0
f     NaN
dtype: float64

s1 + s2
>>
a     NaN
b     7.0
c     9.0
d    13.0
e    11.0
e    13.0
f     NaN
dtype: float64
(2) Dataframe operation
from pandas import Series, DataFrame
import pandas as pd
import numpy as np

df1 = DataFrame(
    np.arange(9).reshape(3,3),
    columns=list("abc"))
print(df1)

>>
   a  b  c
0  0  1  2
1  3  4  5
2  6  7  8

df2 = DataFrame(
    np.arange(16).reshape(4,4),
    columns=list("abcd")
)
print(df2)
>>
    a   b   c   d
0   0   1   2   3
1   4   5   6   7
2   8   9  10  11
3  12  13  14  15

# df는 column과 index를 모두 고려
result1 = df1+df2
print(result1)
>>
      a     b     c   d
0   0.0   2.0   4.0 NaN
1   7.0   9.0  11.0 NaN
2  14.0  16.0  18.0 NaN
3   NaN   NaN   NaN NaN

# add operation을 쓰면 NaN값 0으로 변환
# Operation types: add, sub, div, mul
result2 = df1.add(df2, fill_value=0)
print(result2)
>>
      a     b     c     d
0   0.0   2.0   4.0   3.0
1   7.0   9.0  11.0   7.0
2  14.0  16.0  18.0  11.0
3  12.0  13.0  14.0  15.0
(3) Series + Dataframe
from pandas import Series, DataFrame
import pandas as pd
import numpy as np

df = DataFrame(
    np.arange(16).reshape(4,4),
    columns = list("abcd")
)
print(df)
>>
    a   b   c   d
0   0   1   2   3
1   4   5   6   7
2   8   9  10  11
3  12  13  14  15

s = Series(
    np.arange(10, 14),
    index = list("abcd")
)
print(s)
>>
a    10
b    11
c    12
d    13
dtype: int32

# column을 기준으로 broadcasting이 발생함
result = df + s
print(result)
>>
    a   b   c   d
0  10  12  14  16
1  14  16  18  20
2  18  20  22  24
3  22  24  26  28
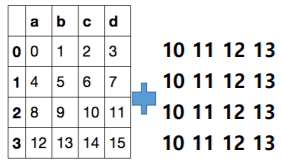
위의 코드를 그림으로 보자면 아래와 같이 broadcasting이 발생한다.

axis를 기준으로도 broadcasting을 할 수 있다. 아래의 코드는 axis를 기준으로 row broadcasting을 실행하는 코드이다.
from pandas import Series, DataFrame
import pandas as pd
import numpy as np


df = DataFrame(
    np.arange(16).reshape(4,4),
    columns = list("abcd")
)
print(df)
>>
    a   b   c   d
0   0   1   2   3
1   4   5   6   7
2   8   9  10  11
3  12  13  14  15


s2 = Series(
    np.arange(10, 14))
print(s2)
>>
a    10
b    11
c    12
d    13
dtype: int32


result1 = df + s2
print(result1)
>>
     a   b   c   d   0   1   2   3
0 NaN NaN NaN NaN NaN NaN NaN NaN
1 NaN NaN NaN NaN NaN NaN NaN NaN
2 NaN NaN NaN NaN NaN NaN NaN NaN
3 NaN NaN NaN NaN NaN NaN NaN NaN

# axis를 기준으로 row broadcasting을 실행
result2 = df.add(s2, axis=0)
print(result2)
>>
    a   b   c   d
0  10  11  12  13
1  15  16  17  18
2  20  21  22  23
3  25  26  27  28
6) lambda, map, apply
(1) Lambda 함수
- 한 줄로 함수를 표현하는 익명 함수 기법
- Lisp 언어에서 시작된 기법 으로 오늘날 현대언어에 많이 사용
lambda argument : expression# 하나의 argument만 처리하는 lambda 함수
f = lambda x : x / 2
# 이름을 할당하지 않는 lambda 함수
(lambda x : x + 1)(5)
(2) map 함수
- 함수와 sequence형 데이터를 인자로 받아 각 element마다 입력받은 함수를 적용하여 list로 반환
- 일반적으로 함수를 lambda형태로 표현함
map(function, sequence)# 두 개 이상의 argument가 있을 때는 두 개의 sequence형을 써야함
f = lambda x, y: x+y
list(map(f, ex, ex))
# 익명 함수 그대로 사용할 수 있으며, python3에서는 list를 꼭 붙여줘야함
list(map(lambda x: x + x, ex))
(3) map for series
- Pandas의 series type의 데이터에도 map 함수 사용 가능
- function 대신 dict, sequence형 자료 등으로 대체 가능
s1 = Series(np.arange(10))
s1.head(5)
>>
0    0
1    1
2    2
3    3
4    4
dtype: int32


s1. map(lambda x: x**2).head(5)
>>
0     0
1     1
2     4
3     9
4    16
dtype: int64


# dic type으로 데이터 교체, 없는 값은 NaN으로 처리
z = {1:'A', 2:'B', 3:'C'}
result1 = s1.map(z).head(5)
print(result1)
>>
0    NaN
1      A
2      B
3      C
4    NaN
dtype: object


# 같은 위치의 데이터를 s2로 전환
s2 = Series(np.arange(10, 20))
result2 = s1.map(s2).head(5)
print(result2)
>>
0    10
1    11
2    12
3    13
4    14
dtype: int32
(4) Replace function
- Map 함수의 기능중 데이터 변환 기능만 담당
- 데이터 변환시 많이 사용하는 함수
# dict type적용
df.sex.replace({"male":0, "female":1}).head()


# Target list Conversion list
df.sex.replace(["male", "female"], [0,1], inplace=True) # inplace = 데이터 변환 결과를 적용
(5) apply for dataframe
- map과 달리, series 전체(column)에 해당 함수를 적용
- 입력값이 series 데이터로 입력받아 handling가능
# 각 column별로 결과값 반환
df_info = df [["earn","height","age"]]
f = lambda x : x.max() - x.min()
df_info.apply(f)
- 내장 연산 함수를 사용할 때도 똑같은 효과를 거둘 수 있음
- mean, std 등 사용 가능
df_info.sum()
df_info.apply(sum)
- scalar 값 이외에 series값의 반환도 가능
def f(x):
    return Series([x.min(), x.max()], index=["min","max"])
df_info.apply(f)
- series 단위가 아닌 element 단위로 함수를 적용함
- series 단위에 apply를 적용시킬 때와 같은 효과
f = lambda x : -x
df_info.applymap(f).head(5)
df_info["earn"].apply(f).head(5)
7) Pandas Built-in functions
(1) describe
- Numeric type 데이터의 요약 정보를 보여줌
df = pd.read_csv("wages.csv")
df.describe()
(2) unique
- series data의 유일한 값을 list를 반환함
# 유일한 인종의 값 list
df.race.unique()

# dict type으로 index
np.array(dict(enumerate(df["race"].unique)))

# label index값과 label값 각각 추출
value = list(map(int, np.array(list(enumerate(df["race"].unique())))[:, 0].tolist()))
key = np.array(list(enumerate(df["race"].unique())),dtype=str)[:,1].tolist()
print(value, key)

# label str -> index 값으로 변환
df["race"].replace(to_replace=key, value=value, inplace=True)
# 성별에 대해서도 동일하게 적용
value = list (map(int, np.array(list(enumerate(df["sex"].unique())))[:,0].tolist()))
key = np.array(list(enumerate(df["race"].unique())),dtype=str)[:,1].tolist()
print(value, key)

# "sex"와 "race" column의 index labelling
df["sex"].replace(to_replace=key, value=value, inplace=True)
df.head(5)
(3) sum
- 기본적인 column 또는 row 값의 연산을 지원
- sub, mean, min, max, count, median, mad, var 등
# column별
df.sum(axis=0)

# row별
df.sum(axis=1)
(4) isnull
- column 또는 row 값의 NaN(null) 값의 index를 반환함
df.isnull()

# Null인 값의 함
df.isnull().sum()
(5) sort_values
- column 값을 기준으로 데이터를 sorting
# ascending = 오름차순
df.sort_values(["age", "earn"], ascending=True).head(10)
(6) Correlation & Convariance
- 상관계수와 공분산을 구하는 함수
- corr, cov, corrwith
df.age.corr(df.earn)

df.age.cov(df.earn)

df.corrwith(df.earn)

df.corr()
참고자료
'IT > 언어' 카테고리의 다른 글
| [python] 머신러닝을 위한 Python(8) ; Data Cleansing (0) | 2020.06.05 |
|---|---|
| [python] 머신러닝을 위한 Python(7) ; Data Handling - Pandas # 2 (0) | 2020.06.05 |
| [python] 머신러닝을 위한 Python(5) ; Data handling - Numerical Python (0) | 2020.06.04 |
| [python] 머신러닝을 위한 Python(4) (0) | 2020.06.04 |
| [python] 머신러닝을 위한 Python(3) (0) | 2020.06.03 |