728x90
※ 일본의 한 블로그 글을 번역한 포스트입니다. 오역 및 의역, 직역이 있을 수 있으며 틀린 내용이 있으면 지적해주시면 감사하겠습니다.
개요
openCV로 이미지에 도형이나 문자를 그릴 수 있는 함수들에 대해서 정리해보았다.
함수 목록
| 도형 | 함수 |
| 텍스트 | cv2.putText |
| 사각형 | cv2.rectangle |
| 원 | cv2.circle |
| 타원 | cv2.ellipse |
| 윤곽 | cv2.drawContours |
| 마커 | cv2.drawMarker |
| 볼록한 폴리곤 | cv2.fillConvexPoly |
| 폴리곤 | cv2.fillPoly |
| 폴리곤의 윤곽선 | cv2.polylines |
| 선 | cv2.line |
| 화살표 | cv2.arrowedLine |
함수 공통 사양
- 색은 color 로 지정한다. 1채널 이미지의 경우는 int, 3채널 이미지의 경우는 int의 튜플로 지정한다 (예 : color=(255, 0, 0))
- 선의 두께는 thickness로 지정한다. 마이너스 값으로 지정한 경우 색이 칠해진다.
- 그려진 도형은 인수로 전달된 배열을 직접 변경한다.
- 점의 좌표나 크기는 float가 아닌, int로 지정한다.
텍스트 그리기 - cv2.putText
주의점은 ASCII 문자이외에는 그려지지 않으므로 ASCII 문자가 아닌 글자를 쓰고자할 때는 Pillow 라이브러리를 사용한다.
lineType = cv2.LINE_AA를 지정하면 안티앨리어싱이 유효화되어 문자의 외곡이 줄어든다.
img = cv2.putText(img, text, org, fontFace, fontScale,
                 color[, thickness[, lineType[, bottomLeftOrigin]]])
인수
| 이름 | 형태 | 기본값 |
| img | ndarray(입력 이미지) | |
| text | str(문자열) | |
| org | tuple of 2 ints(그릴 위치 basline이 시작점) | |
| fontFace | HersheyFonts(폰트의 종류) | |
| fontScale | float (폰트의 배율) | |
| color | int/tutple of ints | |
| thickness | int(문자의 크기) | |
| line_type | LineTypes(선을 그릴 방식) | cv2.LINE_8 |
| bottomLeftOrigin | bool | False(True의 경우 왼쪽 아래를 원점으로 다룬다) |
반환 값
| 이름 | 설명 |
| img | 출력 이미지 |
예시 코드
import cv2
import numpy as np
from IPython.display import Image, display


def imshow(img):
    """ndarray 배열을 인라인으로 Notebook상에 표시한다.
    """
    ret, encoded = cv2.imencode(".jpg", img)
    display(Image(encoded))


img = np.zeros((100, 300, 3), dtype=np.uint8)
cv2.putText(
    img,
    "Hello World",
    (0, 90),
    fontFace=cv2.FONT_HERSHEY_SIMPLEX,
    fontScale=1.0,
    color=(255, 255, 255),
    thickness=2,
    lineType=cv2.LINE_AA,
)
imshow(img)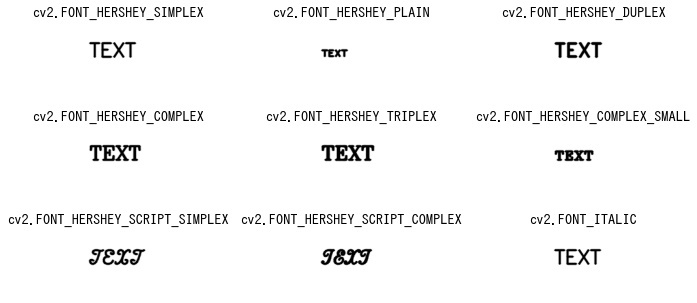
텍스트의 크기를 획득하기 - cv2,getTextSize
retval, baseLine = cv2.getTextSize(text, fontFace, fontScale, thickness)
인수
| 이름 | 형태 | 기본값 |
| text | str(문자열) | |
| fontFace | HersheyFonts(폰트의 종류) | |
| fontScale | float(폰트의 배율) | |
| thickness | int(answkdml zmrl) |
반환값
| 이름 | 설명 |
| (w, h) | 문자의 크기 |
| baseLine | 베이스 라인까지의 거리 |
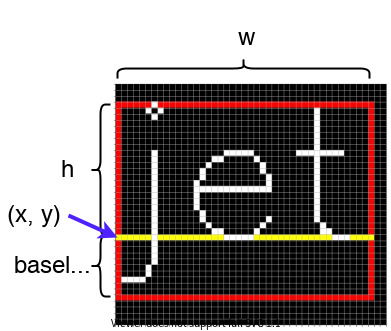
예시코드
img = np.zeros((100, 300, 3), dtype=np.uint8)

text = "Hello World"  # 그릴 문자
fontface = cv2.FONT_HERSHEY_SIMPLEX  # 폰트 종류
fontscale = 1.0  # 문자의 크기
thickness = 2  # 문자의 두께
x, y = 50, 50  # 베이스 라인의 시작점

# 문자열을 그릴 때 크기를 획득한다.
(w, h), baseline = cv2.getTextSize(text, fontface, fontscale, thickness)
print(f"size: ({w}, {h}), baseline: {baseline}")

# 문자열을 감쌀 사각형을 그린다.
cv2.rectangle(img, (x, y - h), (x + w, y + baseline), (0, 0, 255), thickness)

# 베이스 라인을 그린다.
cv2.line(img, (x, y), (x + w, y), (0, 255, 255), thickness)

# 문자열을 이미지에 그린다.
cv2.putText(img, text, (x, y), fontface, fontscale, (255, 255, 255), thickness)
imshow(img)
size: (176, 22), baseline: 10
사각형 그리기 - cv2. rectagle
img = cv2.rectangle(img, pt1, pt2, color[, thickness[, lineType[, shift]]])
인수
| 이름 | 형태 | 기본값 |
| img | ndarray(입력 이미지) | |
| pt1 | tuple of 2 ints(사각형 왼쪽 위의 좌표) | |
| pt2 | tuple of 2inst(사각형 오른쪽 아래의 좌표) | |
| color | int/tuple of ints | |
| thickness | int(선의 두께, 마이너스 값은 색 채우기) | |
| line_type | LineTypes(선을 그릴 방법) | cv2.LINE_8 |
| shift | int(플러스 값의 경우, 좌표를 1/shift 배로 스케일화) | 0 |
반환값
| 이름 | 설명 |
| img | 출력 이미지 |
예시 코드
img = np.zeros((300, 300, 3), dtype=np.uint8)
cv2.rectangle(img, (50, 50), (250, 250), color=(255, 0, 0), thickness=2)
imshow(img)
img = np.zeros((300, 300, 3), dtype=np.uint8)
cv2.rectangle(img, (50, 50), (250, 250), color=(255, 0, 0), thickness=-1)
imshow(img)
원 그리기 - cv2.circle
img = cv2.circle(img, center, radius, color[, thickness[, lineType[, shift]]])
인수
| 이름 | 형태 | 기본값 |
| img | ndarray(입력 이미지) | |
| center | tutple of ints(원의 중심) | |
| radius | int(원의 반경) | |
| color | int/tuple of ints(색) | |
| thickness | int(선의 두께, 마이너스 값은 색 채우기) | |
| line_type | LineTypes(선의 그리는 방법) | cv2.LINE_8 |
| shift | int(플러스 값의 경우 좌표를 1/shift 배로 스케일화) |
반환값
| 이름 | 설명 |
| img | 출력 이미지 |
예시코드
img = np.zeros((300, 300, 3), dtype=np.uint8)

# 塗りつぶさない円
cv2.circle(img, (150, 150), 100, color=(255, 0, 0), thickness=2)
imshow(img)
img = np.zeros((300, 300, 3), dtype=np.uint8)

# 색을 채운 원
cv2.circle(img, (150, 150), 100, color=(255, 0, 0), thickness=-1)
imshow(img)
타원 그리기 - cv2.ellipse
img = cv2.ellipse(
    img, center, axes, angle, startAngle, endAngle, color[, thickness[, lineType[, shift]])
인수
| 이름 | 형태 | 기본값 |
| img | ndarray(입력 이미지) | |
| center | tuple of 2 ints(타원의 중심) | |
| axes | tuple of 2 ints(타원의 직경의 긴쪽 길이와 짧은 쪽 길이) | |
| angle | float(타원의 회전 각도) | |
| startAngle | float(원호의 시작 각도) | |
| endAngle | float(원호의 종료 각도) | |
| color | int/tuple of ints(색) | |
| thickness | int(선의 두께, 마이너스 값인 경우 색 채우기) | 1 |
| line_type | LinTypes(선 그리는 방법) | cv2.LINE_8 |
| shift | int(플러스 값의 경우 좌표를 1/shift 배로 스케일화) | 0 |
반환값
| 이름 | 설명 |
| img | 출력 이미지 |
예시 코드
img = np.zeros((300, 300, 3), dtype=np.uint8)
cv2.ellipse(
    img,
    (150, 150),
    (50, 70),
    angle=45,
    startAngle=0,
    endAngle=360,
    color=(255, 0, 0),
    thickness=2,
)
imshow(img)
img = np.zeros((300, 300, 3), dtype=np.uint8)
cv2.ellipse(
    img,
    (150, 150),
    (50, 70),
    angle=45,
    startAngle=0,
    endAngle=360,
    color=(255, 0, 0),
    thickness=-1,
)
imshow(img)
img = np.zeros((300, 300, 3), dtype=np.uint8)
cv2.ellipse(
    img,
    (150, 150),
    (50, 70),
    angle=45,
    startAngle=0,
    endAngle=100,
    color=(255, 0, 0),
    thickness=2,
)
imshow(img)
img = np.zeros((300, 300, 3), dtype=np.uint8)
cv2.ellipse(
    img,
    (150, 150),
    (50, 70),
    angle=45,
    startAngle=0,
    endAngle=100,
    color=(255, 0, 0),
    thickness=-1,
)
imshow(img)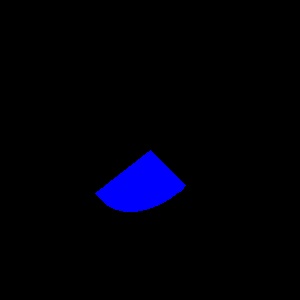
윤곽 그리기 - cv2.drawContours
image = cv2.drawContours(image, contours, contourIdx,
                        color[, thickness[, lineType[, hierarchy[, maxLevel[, offset]]]]])
인수
| 이름 | 형태 | 기본값 |
| img | ndarray(입력 이미지) | |
| contours | list of ndarrays(윤곽의 목록) | |
| contourIdx | int(윤곽 목록 중 그릴 윤곽의 인덱스, 모든 윤곽을 그리고 싶은 경우 마이너스 값) | |
| color | int/tuple of ints(색) | |
| thickness | int(선의 두께, 마이너스 값인 경우 색 채우기) | 1 |
| line_type | LinTypes(선 그리는 방법) | cv2.LINE_8 |
| hierarchy | ndarray(윤곽의 계층 구조, maxLevel을 지정할 경우에 전달됨) | None |
| maxLevel | int(계층의 깊이를 어디까지 그릴까를 지정, 0의 경우는 contourIdx에서 시정한 육관만 그리고, 1 이상의 값의 경우, 지정한 깊이의 윤곽선까지 그림) | int의 최대값 |
| offset | tutple of 2 ints(오프셋) | (0, 0) |
반환값
| 이름 | 설명 |
| img | 출력 이미지 |
예제코드
모든 윤곽을 그릴 경우
# 이미지 읽어들이기
img = cv2.imread("sample1.jpg")

# 흑백화
gray = cv2.cvtColor(img, cv2.COLOR_BGR2GRAY)

# 2진화
ret, bin_img = cv2.threshold(gray, 0, 255, cv2.THRESH_BINARY + cv2.THRESH_OTSU)

# 윤곽추출
contours, hierarchy = cv2.findContours(bin_img, cv2.RETR_EXTERNAL, cv2.CHAIN_APPROX_SIMPLE)

# 모든 윤곽을 그리기
dst = cv2.drawContours(img.copy(), contours, -1, color=(0, 255, 0), thickness=3)
imshow(dst)
색을 채우고 싶은 때는 윤곽 코드를 다음과 같이 변경하면 된다.
dst = cv2.drawContours(img.copy(), contours, -1, color=(0, 255, 0), thickness=-1)
imshow(dst)
지정한 윤곽선만 그리고 싶은 경우는 다음과 같이 코드를 쓸 수 있다.
dst = cv2.drawContours(img.copy(), contours, 2, color=(0, 255, 0), thickness=2)
imshow(dst)
마커 그리기 - cv2.drawMarker
img = cv2.drawMarker(
    img, position, color[, markerType[, markerSize[, thickness[, line_type]]]])
인수
| 이름 | 형태 | 기본값 |
| img | ndarray(입력 이미지) | |
| position | tuple of 2 inst(위치) | |
| color | int/tuple of ints(색) | |
| markerType | MarkerTypes(마커의 종류) | cv2.MARKER_CROSS |
| markerSize | int(마커의 크기) | 20 |
| thiockness | int(선의 두께, 마이너스 값은 색 채우기) | |
| line_type | LineTypes(선 그리는 방법) | cv2.LINE_8 |
반환값
| 이름 | 설명 |
| img | 출력 이미지 |
예시 코드
img = np.zeros((100, 100, 3), dtype=np.uint8)
cv2.drawMarker(
    img, (50, 50), color=(255, 0, 0), markerType=cv2.MARKER_TILTED_CROSS, thickness=2
)
imshow(img)
from matplotlib import pyplot as plt

markers = [
    "cv2.MARKER_CROSS",
    "cv2.MARKER_TILTED_CROSS",
    "cv2.MARKER_STAR",
    "cv2.MARKER_DIAMOND",
    "cv2.MARKER_SQUARE",
    "cv2.MARKER_TRIANGLE_UP",
    "cv2.MARKER_TRIANGLE_DOWN",
]

fig = plt.figure(figsize=(8, 8), facecolor="w")

for i, marker in enumerate(markers, 1):
    img = np.zeros((100, 100, 3), dtype=np.uint8)
    cv2.drawMarker(
        img, (50, 50), color=(255, 0, 0), markerType=eval(marker), thickness=2
    )

    ax = fig.add_subplot(3, 3, i)
    ax.set_title(marker)
    ax.imshow(img[..., ::-1])
    ax.set_axis_off()

plt.show()
볼록한 폴리곤 그리기 - cv2.fillConvecPoly
img = cv2.fillConvexPoly(img, points, color[, lineType[, shift]])
인수
| 이름 | 형태 | 기본값 |
| img | ndarray(입력 이미지) | |
| points | ndarray(점의 목록) | |
| color | int/tuple of ints(tor) | |
| line_type | LineTypes(선 그리는 방법) | cv2.LINE_8 |
| shift | int(플러스 값의 경우, 좌표를 1/shift 배로 스케일화) | 0 |
반환값
| 이름 | 설명 |
| img | 출력 이미지 |
예시 코드
img = np.zeros((300, 300, 3), dtype=np.uint8)
points = np.array([[100, 100], [120, 180], [190, 250], [270, 120], [220, 50]])

cv2.fillConvexPoly(img, points, color=(0, 255, 0))
imshow(img)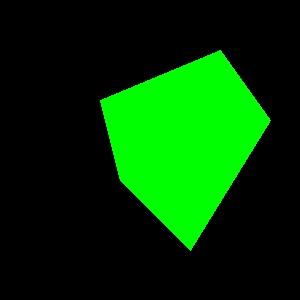
폴리곤 그리기 - cv2.fillPoly
img = cv2.fillPoly(img, pts, color[, lineType[, shift[, offset]]])
인수
| 이름 | 형태 | 기본값 |
| img | ndarray(입력 이미지) | |
| points | ndarray(점의 목록) | |
| color | int/tuple of ints(tor) | |
| line_type | LineTypes(선 그리는 방법) | cv2.LINE_8 |
| shift | int(플러스 값의 경우, 좌표를 1/shift 배로 스케일화) | 0 |
| offset | tupel of 2 ints(오프셋) | (0, 0) |
반환값
| 이름 | 설명 |
| img | 출력 이미지 |
예시 코드
img = np.zeros((300, 300, 3), dtype=np.uint8)
points = np.array([[100, 50], [120, 180], [50, 250], [270, 120], [220, 50]]).reshape(
    1, -1, 2
)

cv2.fillPoly(img, points, color=(0, 255, 0))
imshow(img)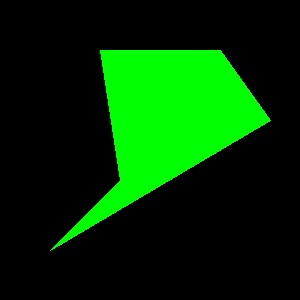
폴리곤 윤곽선 그리기 - cv2.polylines
img = cv2.polylines(img, pts, isClosed, color[, thickness[, lineType[, shift]]])
인수
| 이름 | 형태 | 기본값 |
| img | ndarray(입력 이미지) | |
| pts | ndarray(점의 목록) | |
반환값
| 이름 | 설명 |
| img | 출력 이미지 |
예시코드
img = np.zeros((300, 300, 3), dtype=np.uint8)
points = np.array([[100, 50], [120, 180], [50, 250], [270, 120], [220, 50]]).reshape(
    1, -1, 2
)

cv2.polylines(img, points, isClosed=True, color=(0, 255, 0), thickness=2)
imshow(img)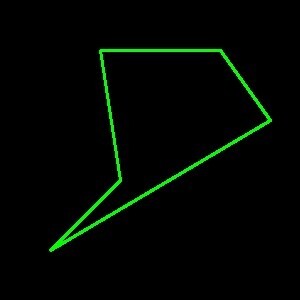
선 그리기 - cv2.line
img = cv2.line(img, pt1, pt2, color[, thickness[, lineType[, shift]]])
인수
| 이름 | 형태 | 기본값 |
| img | ndarray(입력 이미지) | |
| pt1 | tuple of 2 ints(선의 시작점) | |
| pt2 | tuple of 2 insts(선의 종료지점) | |
| color | int/tuple of ints(색) | |
| thickness | int(선의 두께) | |
| line_type | LineTypes(선을 그리는 방법) | cv2.LINE_8 |
| shift | int(플러스 값의 경우, 좌표를 1/shift 배에 스캐일화) | 0 |
| offset | tuple of ints(오프셋) |
반환값
| 이름 | 설명 |
| img | 출력 이미지 |
예시코드
img = np.zeros((300, 300, 3), dtype=np.uint8)
cv2.line(img, (50, 50), (250, 250), color=(255, 0, 0), thickness=2)
imshow(img)

화살표 그리기 - cv2.arrowedLine
img = cv2.arrowedLine(
    img, pt1, pt2, color[, thickness[, line_type[, shift[, tipLength]]]])
인수
| 이름 | 형태 | 기본값 |
| img | ndarray(입력 이미지) | |
| pt1 | tuple of 2 ints(화살표 시작점) | |
| pt2 | tuple of ints(화살표 종료 지점) | |
| color | int/tuple of ints(색) | |
| thickness | int(선의 두께, 마이너스 값은 색 채우기) | 1 |
| line_type | LineTypes(선의 종류) | cv2.LINE_8 |
| shift | int(플러스 값의 경우, 좌표를 1/shift 배로 스케일화) | 0 |
| tiplength | float(화살표의 말단 길이) | 0.1 |
반환값
| 이름 | 설명 |
| img | 출력 이미지 |
예시 코드
img = np.zeros((300, 300, 3), dtype=np.uint8)
cv2.arrowedLine(img, (50, 50), (250, 250), color=(255, 0, 0), thickness=2)

imshow(img)
참고자료
728x90
'IT > 언어' 카테고리의 다른 글
| [python] 사전형의 리스트(list내의 dict)에서 키, 값 검색하기;get 메소드, filter 함수, 내포 표기 (0) | 2022.09.05 |
|---|---|
| [python/numpy] 0 이외의 요소를 추출하는 numpy.nonzero()의 사용법 (0) | 2022.08.20 |
| [python/openCV] 가로세로 비율을 유지한 채로 이미지를 리사이즈하기(이미지 사이즈 변경) (0) | 2022.08.08 |
| [python/scipy] scipy.interpolate.interp2d를 이용한 2차원 데이터 보간 (0) | 2022.08.04 |
| [python] python의 datetime으로 날짜, 시간 ⇔ 문자형 데이터 변환(strtime, strptime) (0) | 2022.07.31 |